I led the design of innovative product solutions to enhance energy operations and drilling efficiency. The platform has helped users reduce vibration levels by up to ~10%, increase rotary rate of penetration by 35–45%, and save $90K–150K per well, contributing to multi-day rig time reductions.
Dashboard
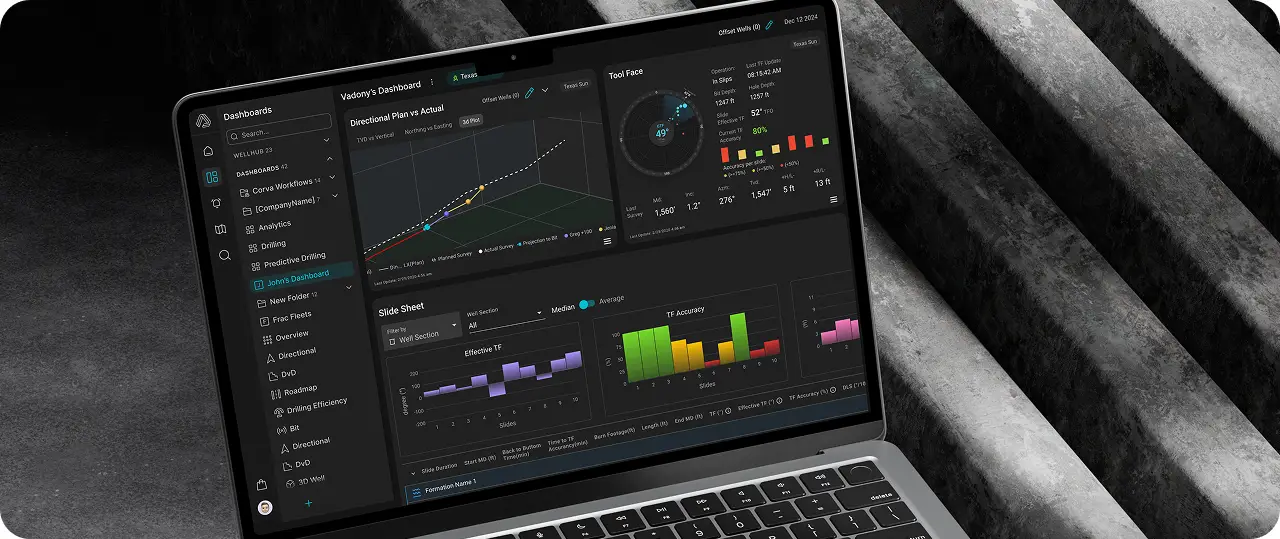
As the lead designer on one of Corva’s most critical initiatives – the redesign of the main dashboard used across all user types. I guide the product discovery and delivery process.
Problem
The existing dashboard had become overwhelmed with complexity, particularly in the side navigation and header, leading to a cluttered and inefficient user experience. Through stakeholder interviews, user feedback, and usage analytics, I identified the pain points: inconsistent navigation, lack of focus, and visual overload.
Solution
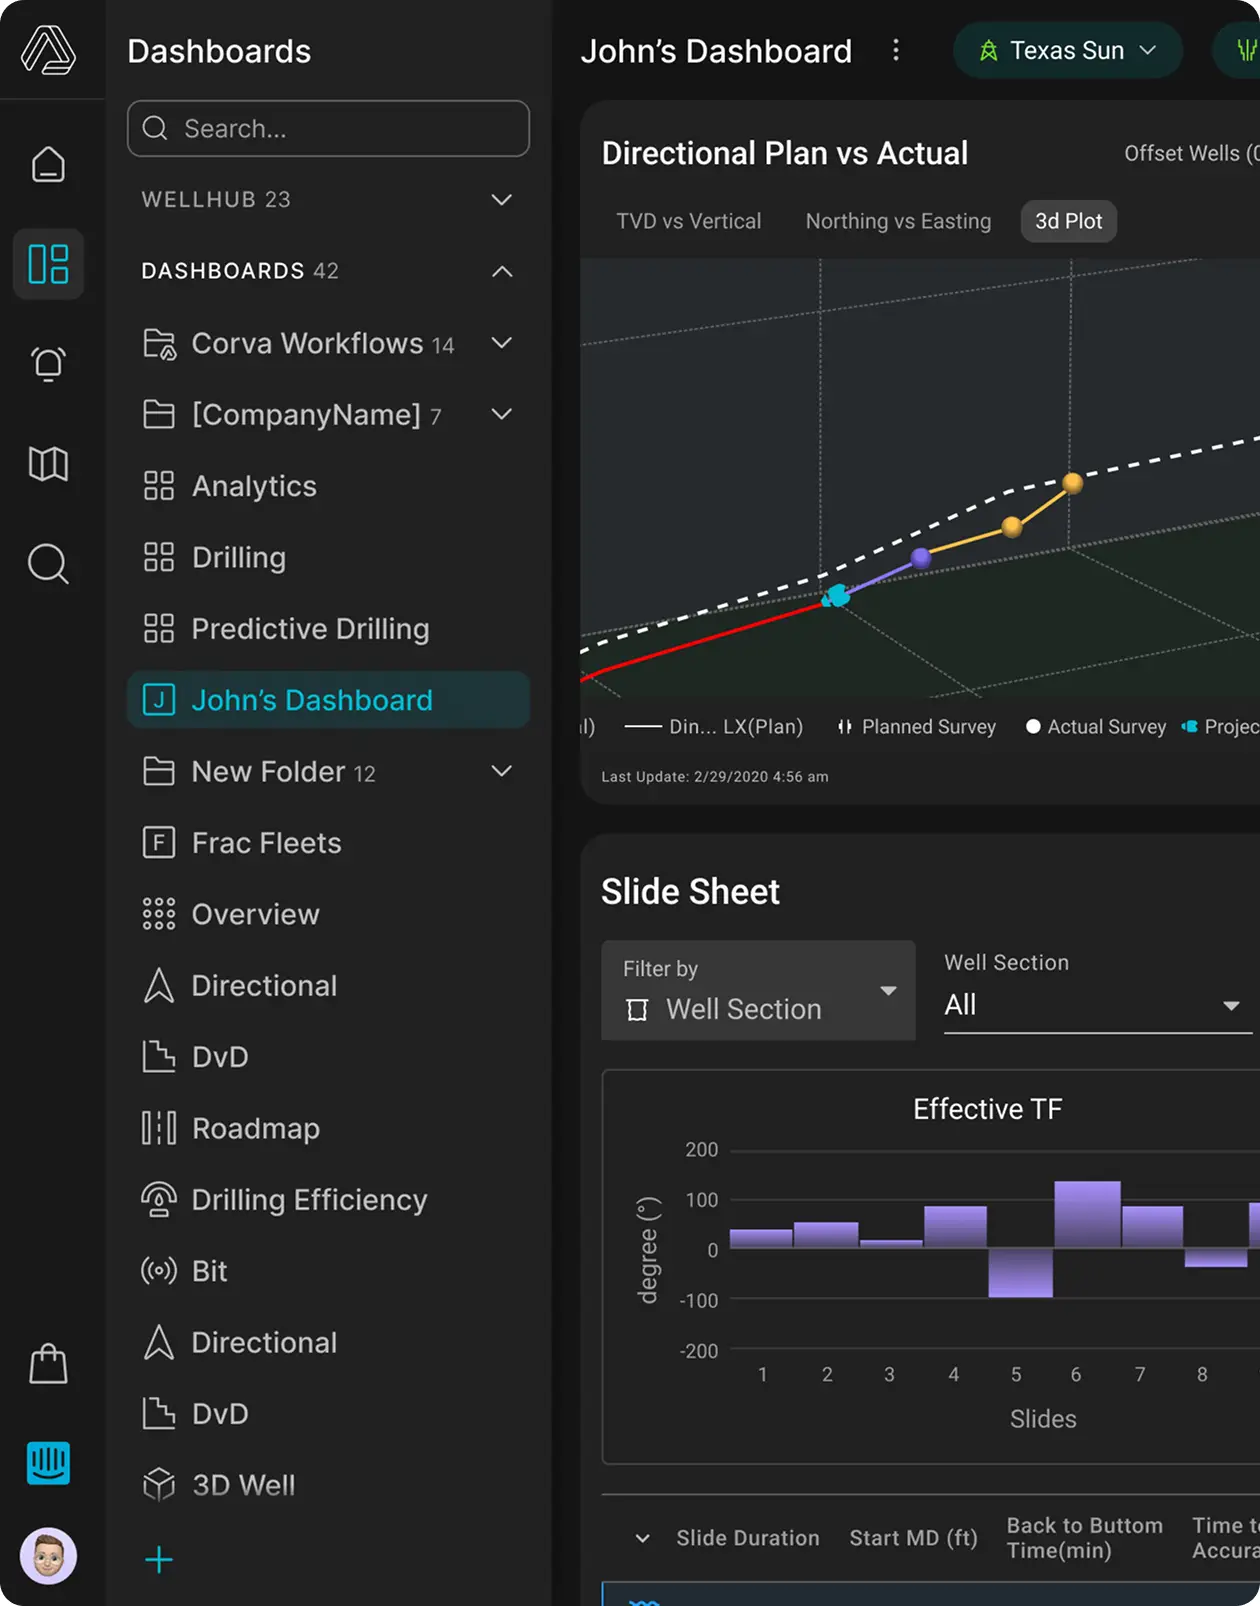
I led the end-to-end design of the main dashboard interface, introducing a clean, customizable layout that allows users to tailor their data views, while maintaining a consistent side menu and header across all roles. Key improvements included:
- Simplified navigation structure and visual hierarchy
- Modular widgets that users can add, remove, or rearrange
- Improved scalability for future tool integrations
Impact
The redesigned dashboard became the core entry point of Corva’s platform, significantly improving usability and user satisfaction. It provided a clear, flexible structure for real-time monitoring, aligned with the company’s scalable product vision.
“Ask Corva” copilot
For two years I was working in a US company developing a wide range of real-time and innovative product solutions to power energy operations.
Problem
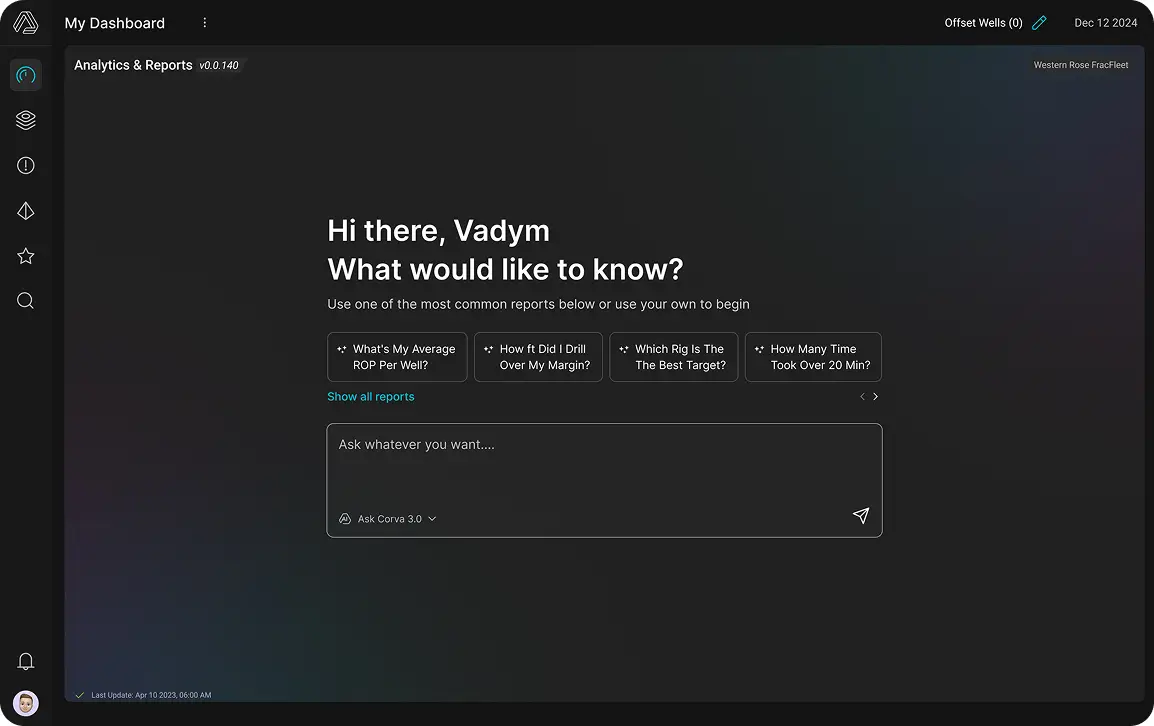
The core problem was clear: users needed faster access to relevant analytics without digging through multiple dashboards. We defined the goal as creating a tool that would make Corva’s deep data accessible through simple interaction.
Solution
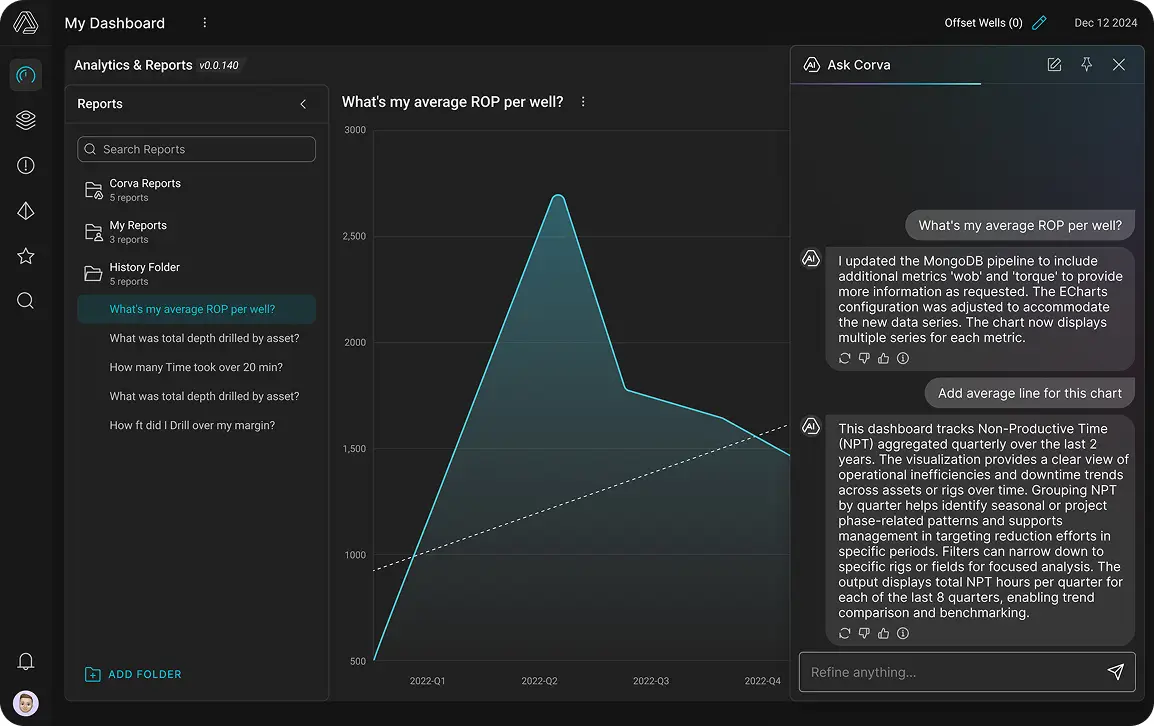
I designed the “Ask Corva”, an AI assistant that enables users to type custom prompts or select from ready-to-use queries. The system responds with real-time analytics, visualised through charts, graphs, and actionable summaries. Key contributions included:
- Clean, intuitive prompt interface
- Smart suggestions and context-aware prebuilt prompts
- Seamless integration with Corva’s data visualisations and rig performance metrics
Impact
The “Ask Corva” feature significantly improved speed and ease of data access, empowering users to ask complex operational questions and receive visual answers in seconds. By reducing time-to-insight and increasing data confidence, this tool became a critical addition to the Corva platform.